CATEGORY
CATEGORY
CATEGORY
News
News
News
Recycled Materials: Global Market Size & 2030 Outlook
Recycled Materials: Global Market Size & 2030 Outlook
Recycled Materials: Global Market Size & 2030 Outlook

As carbon neutrality policies tighten and raw material price volatility intensifies, the industrial economy is shifting from linear to circular. Recycled materials — plastics, metals, and textiles — are no longer an environmental choice. They are becoming a structural pillar of manufacturing supply chains.
Why the Recycled Materials Market Matters
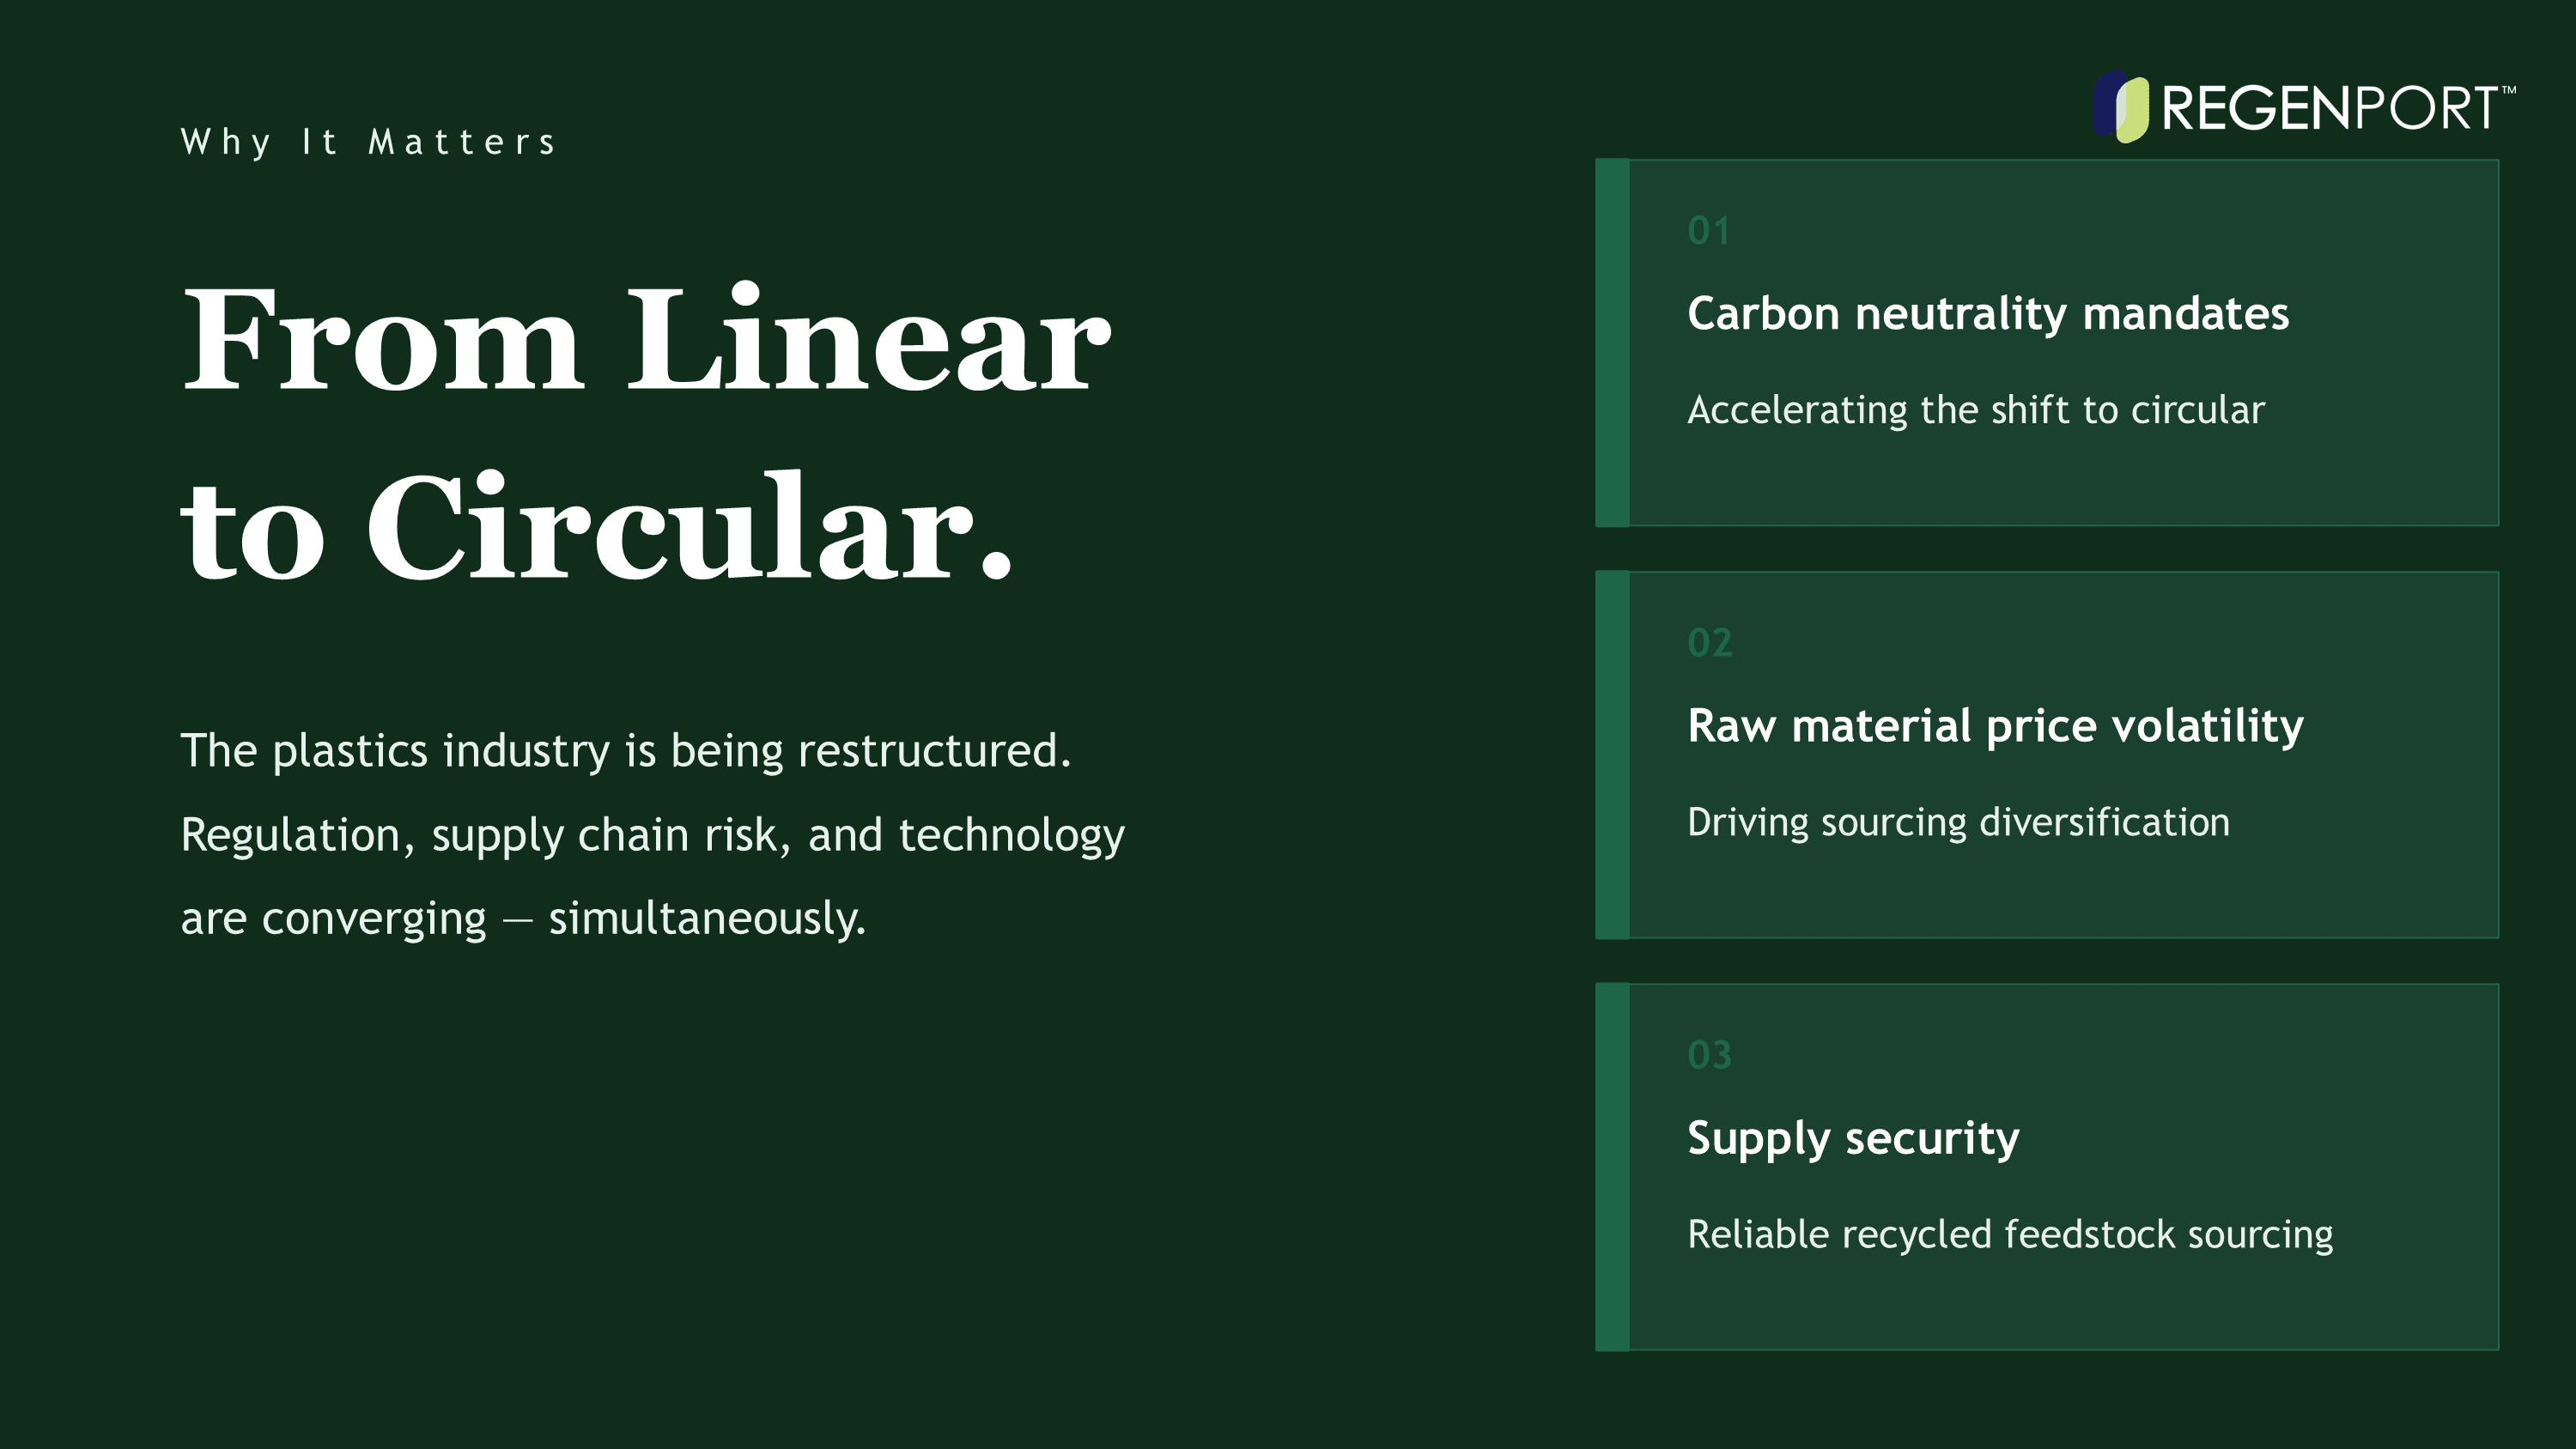
The transition from a linear economy — extract, produce, discard — to a circular one is no longer a long-range ambition. It is being accelerated by two structural pressures: carbon neutrality mandates and raw material price volatility.
In response, recycled materials are gaining strategic importance across plastics, metals, and textile manufacturing. The question for procurement and supply chain teams is no longer whether to source recycled feedstock — it is how to secure reliable supply.
Global Market Outlook by Recycled Material
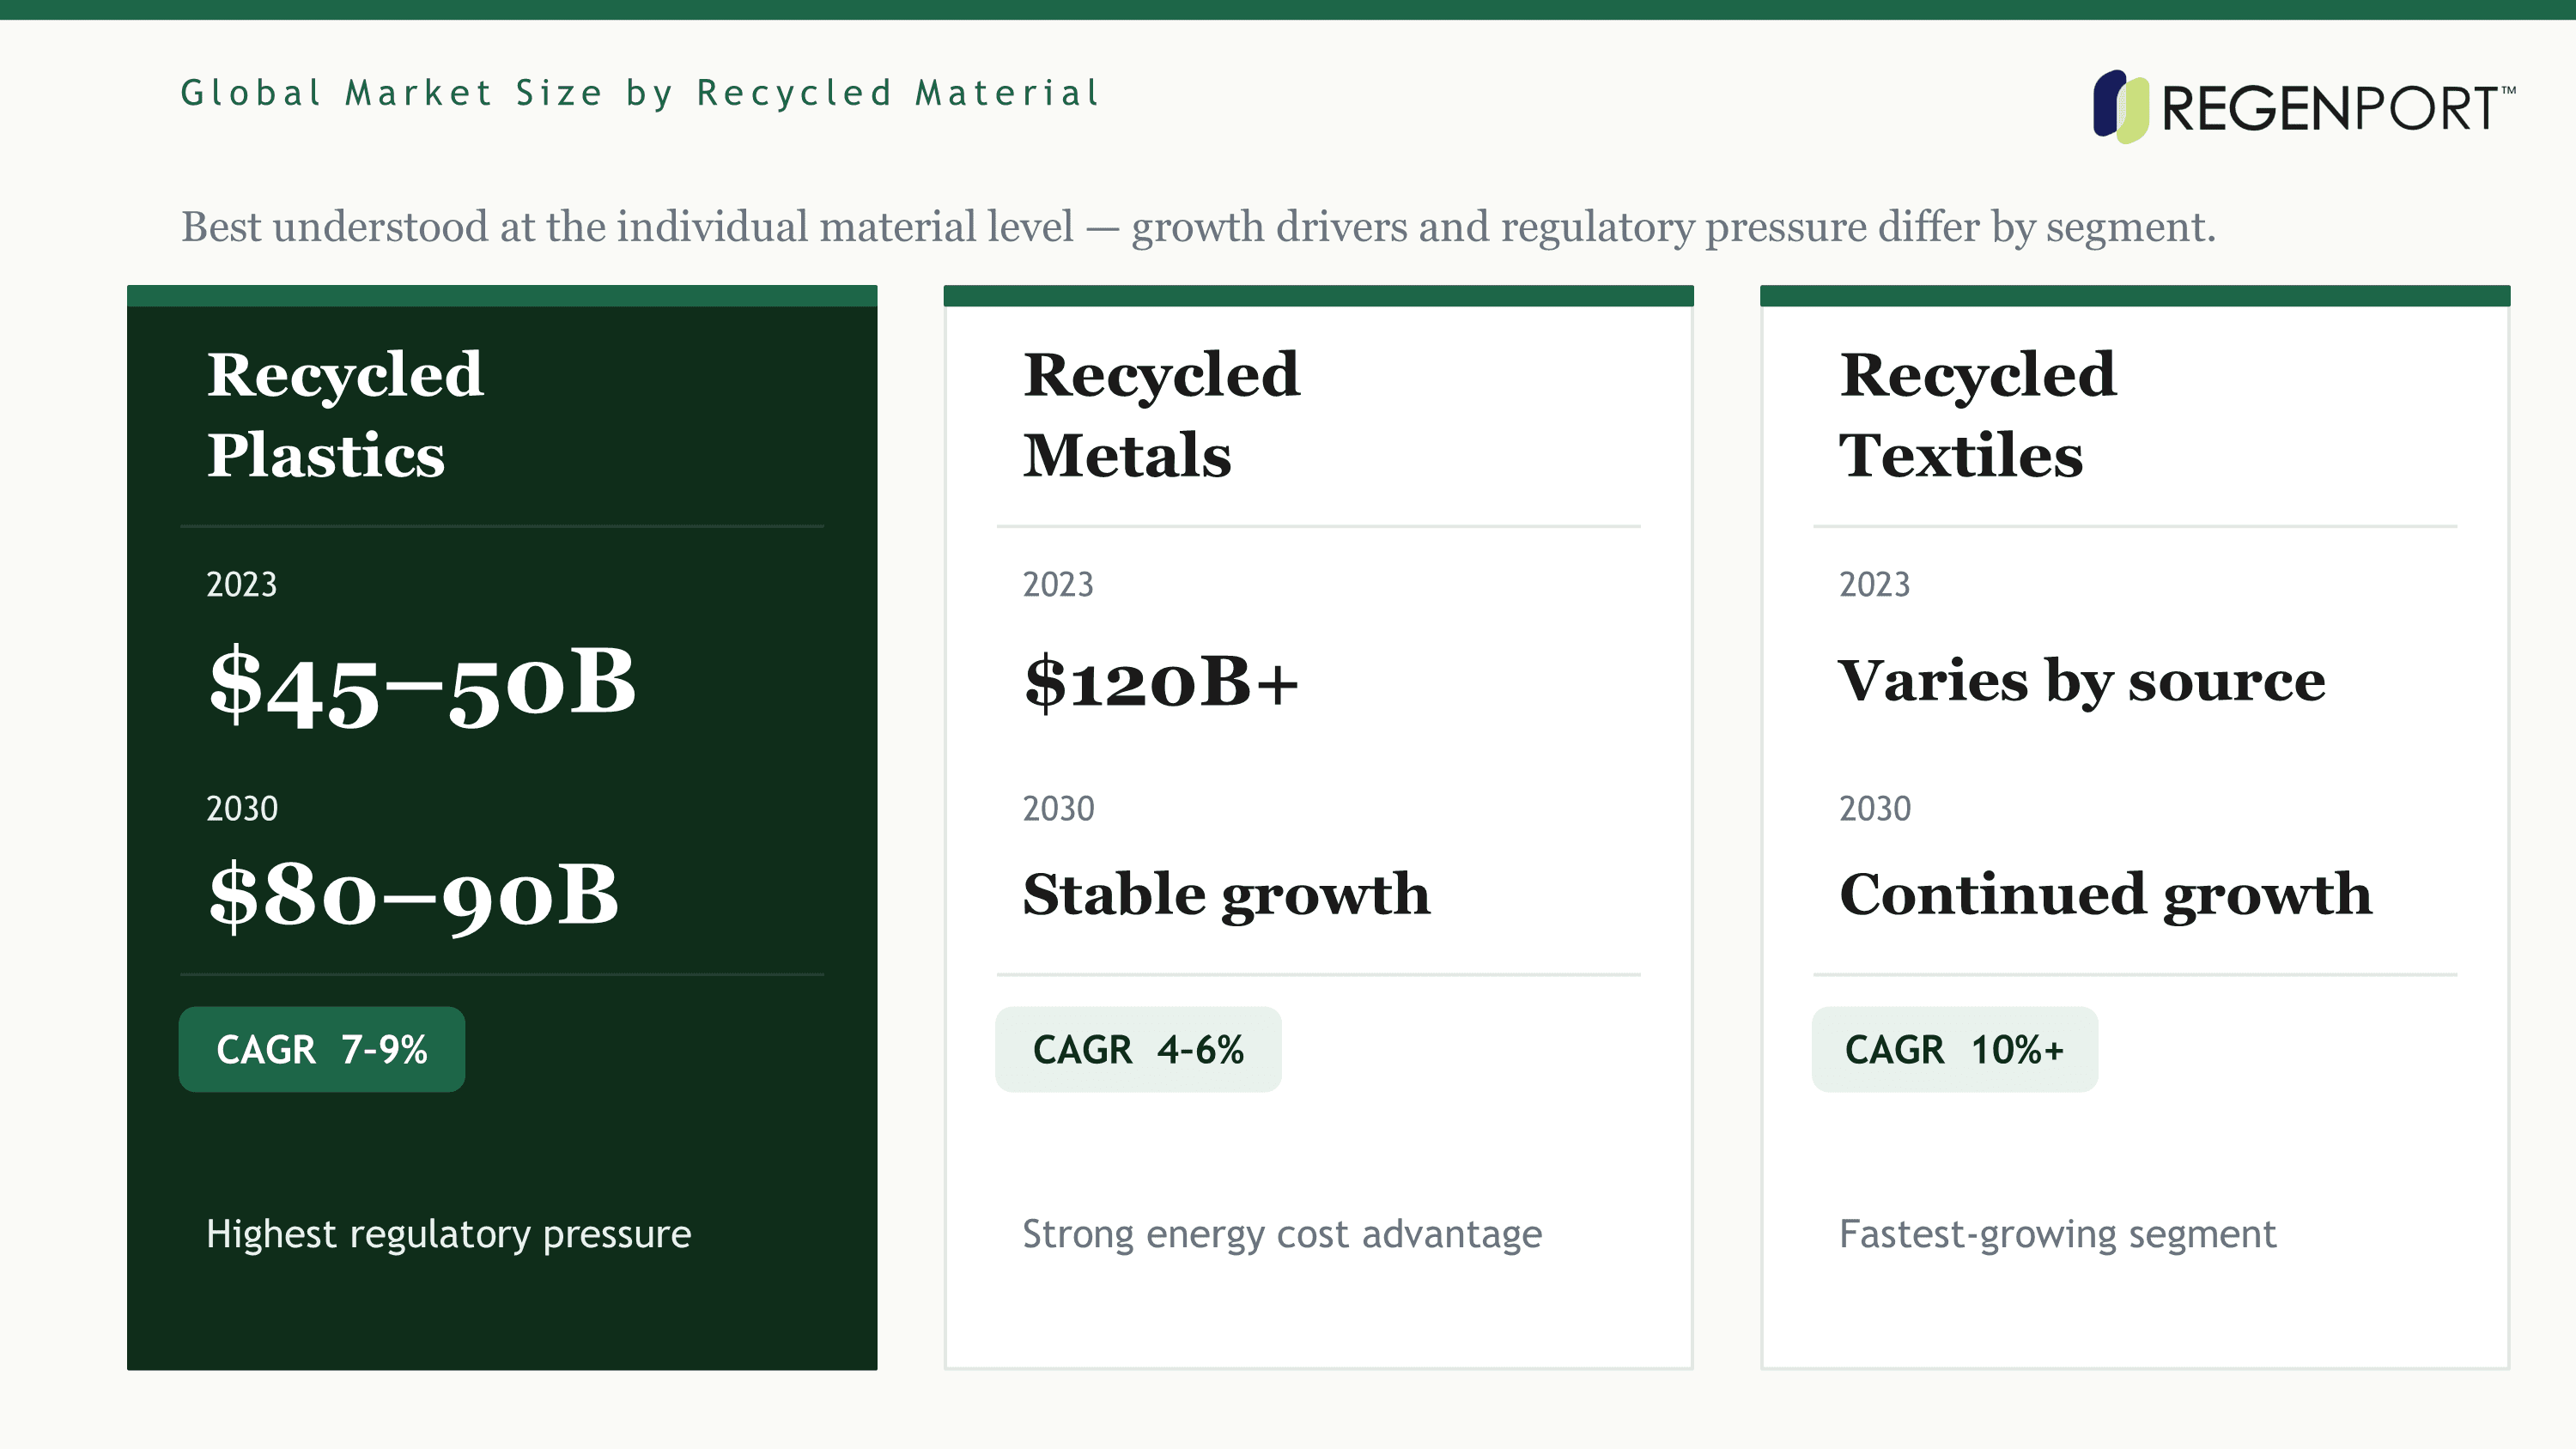
The global recycled materials market is best understood at the individual material level. Aggregated figures may not fully capture the different growth drivers, regulatory environments, and competitive structures across recycled plastics, recycled metals, and recycled textiles.
Material | 2023 Market Size | 2030 Projection | CAGR |
|---|---|---|---|
Recycled Plastics | $45 ~ 50 billion | $80 ~ 90 billion | 7 ~ 9% |
Recycled Metals | $120+ billion | Stable growth | 4 ~ 6% |
Recycled Textiles | Varies by source | Continued growth | Varies widely |
※ Market size and growth rate figures vary depending on the research provider and market definition. The data above is based on publicly available research and should be treated as reference estimates.
While growth rates differ across materials, the recycled materials market as a whole is projected to maintain stable, sustained growth through 2030.
What Is Driving Market Growth
Regulatory Expansion
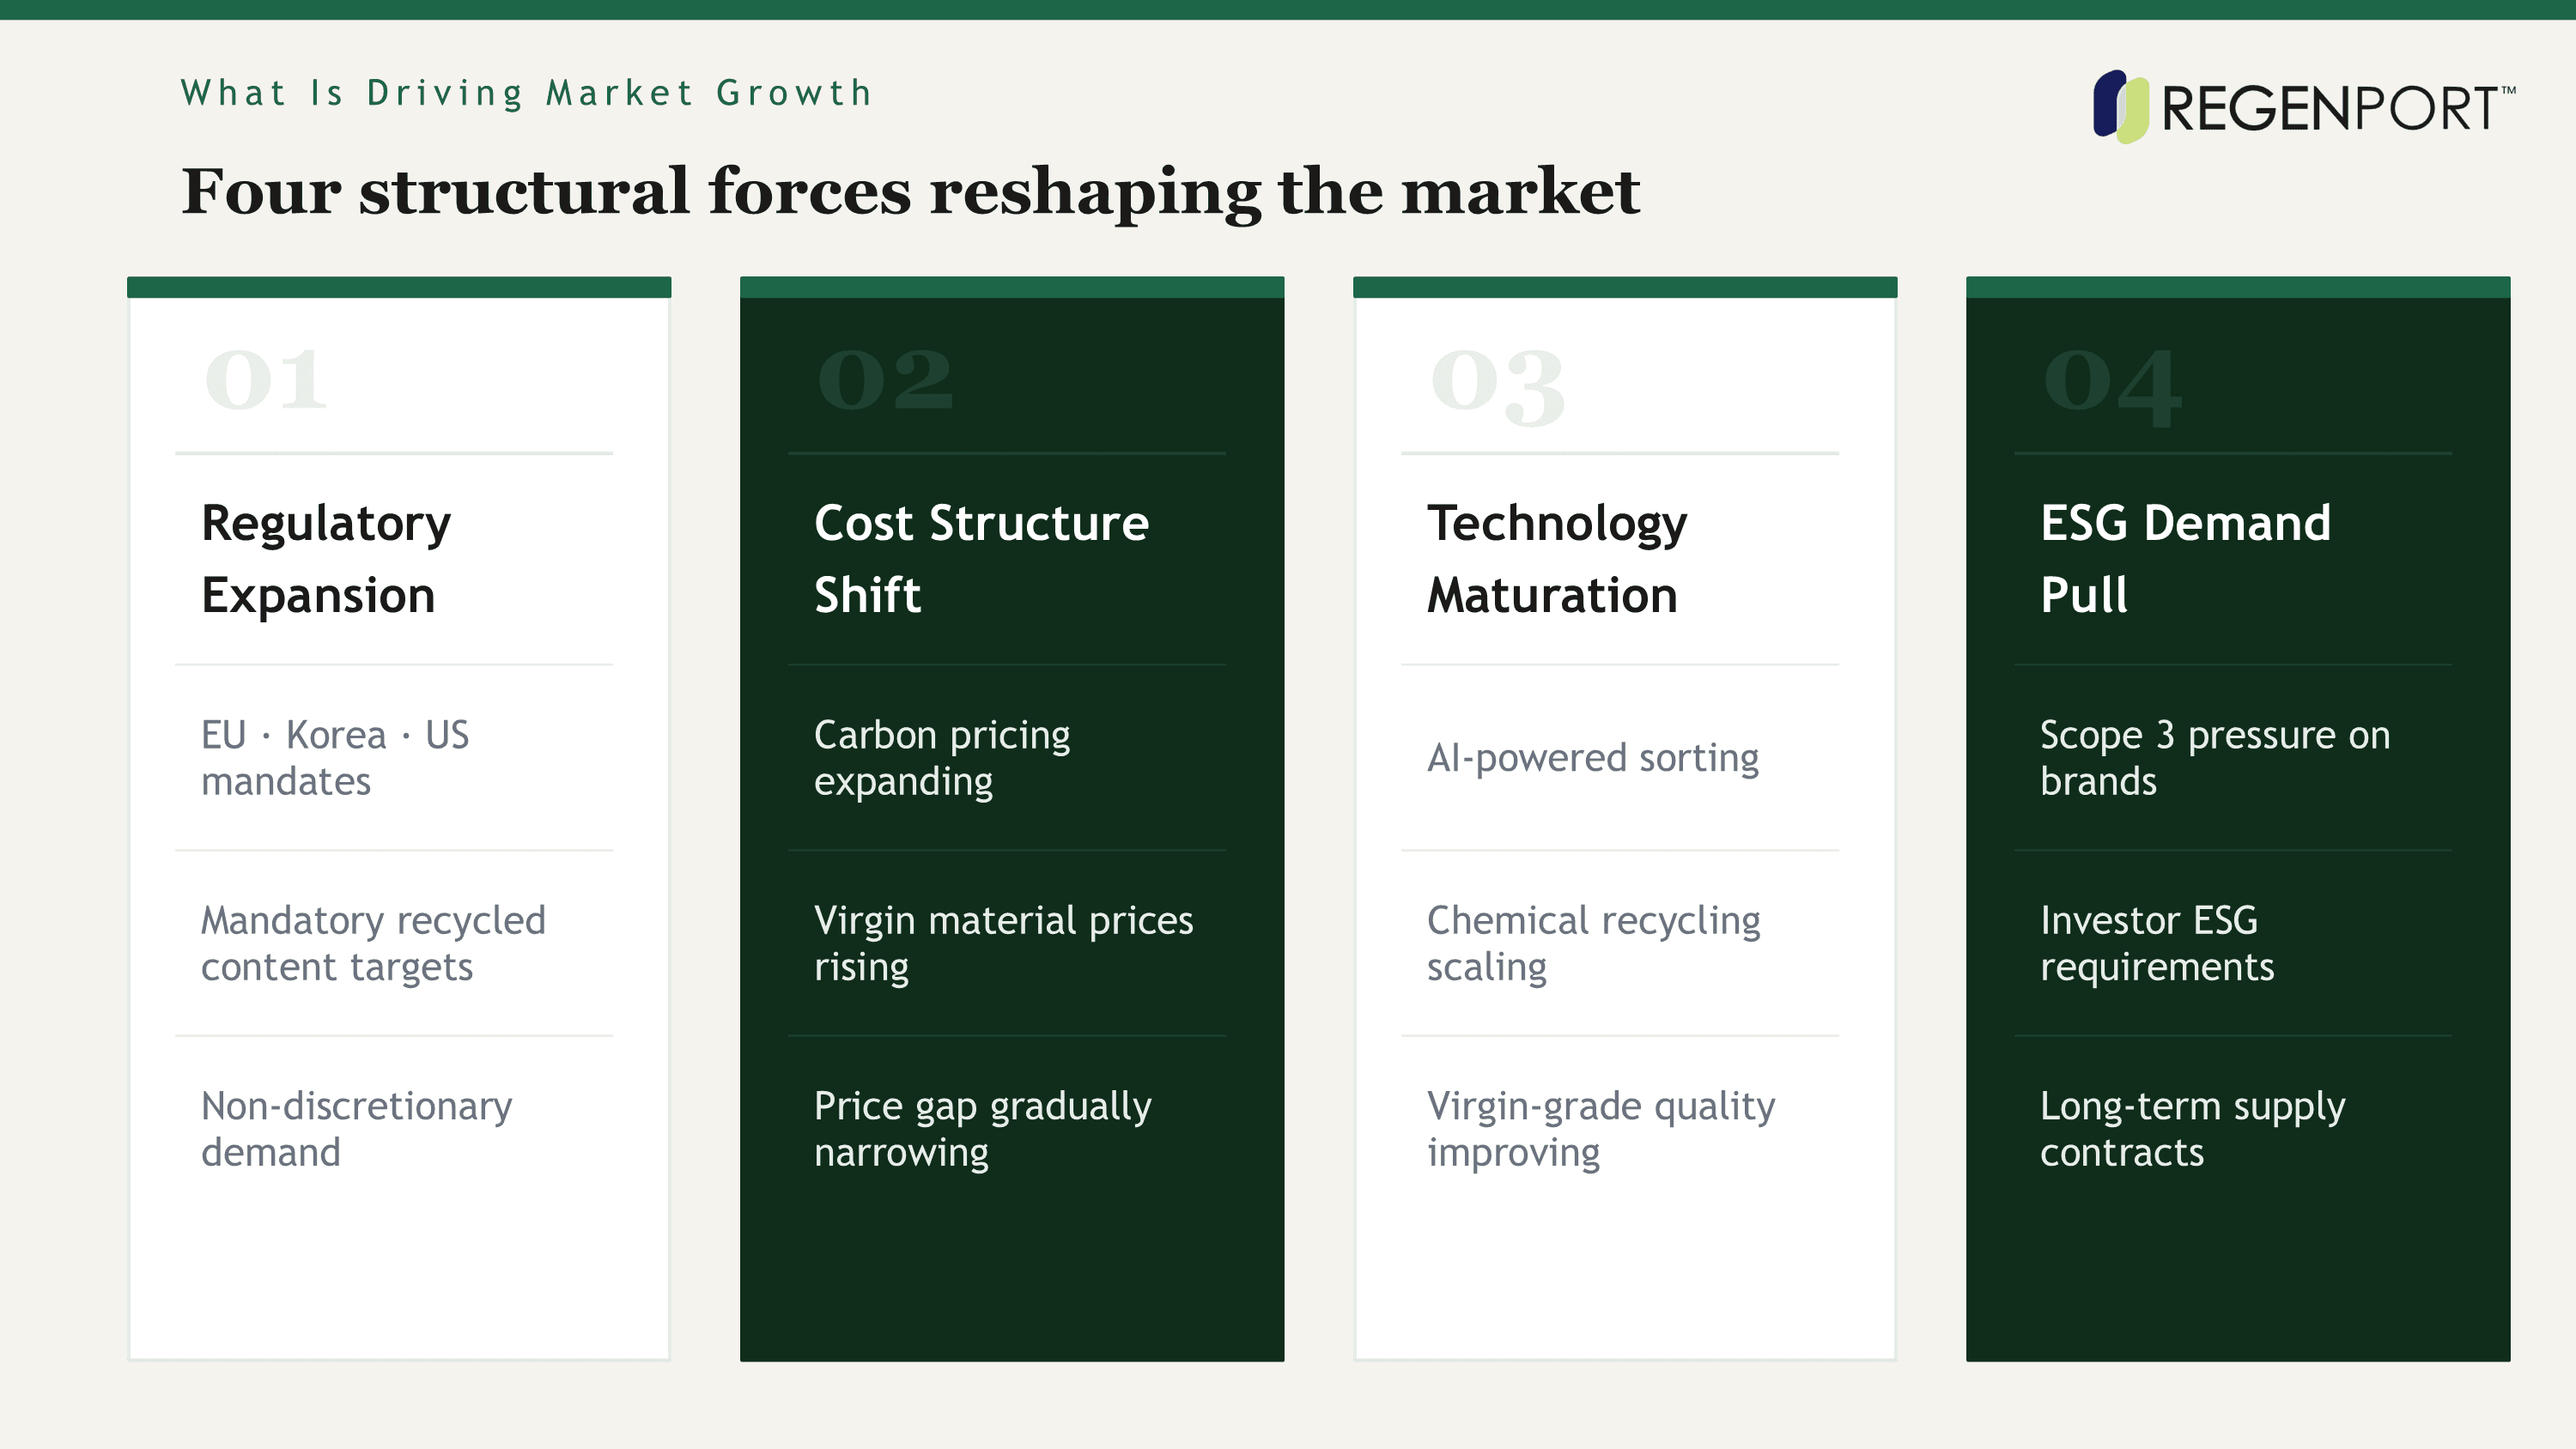
Mandatory recycled content requirements are being enacted across the EU, Korea, and US states — creating structural, non-discretionary demand.
Cost Structure Shift
Rising virgin material prices and carbon cost mechanisms are improving the economic competitiveness of recycled feedstock.
Technology Maturation
AI-powered sorting, chemical recycling, and fiber-to-fiber textile processes are closing the quality gap with virgin materials.
ESG Demand Pull
Corporate sustainability commitments and investor ESG requirements are generating consistent pull-through demand across supply chains.
Regulation in Detail
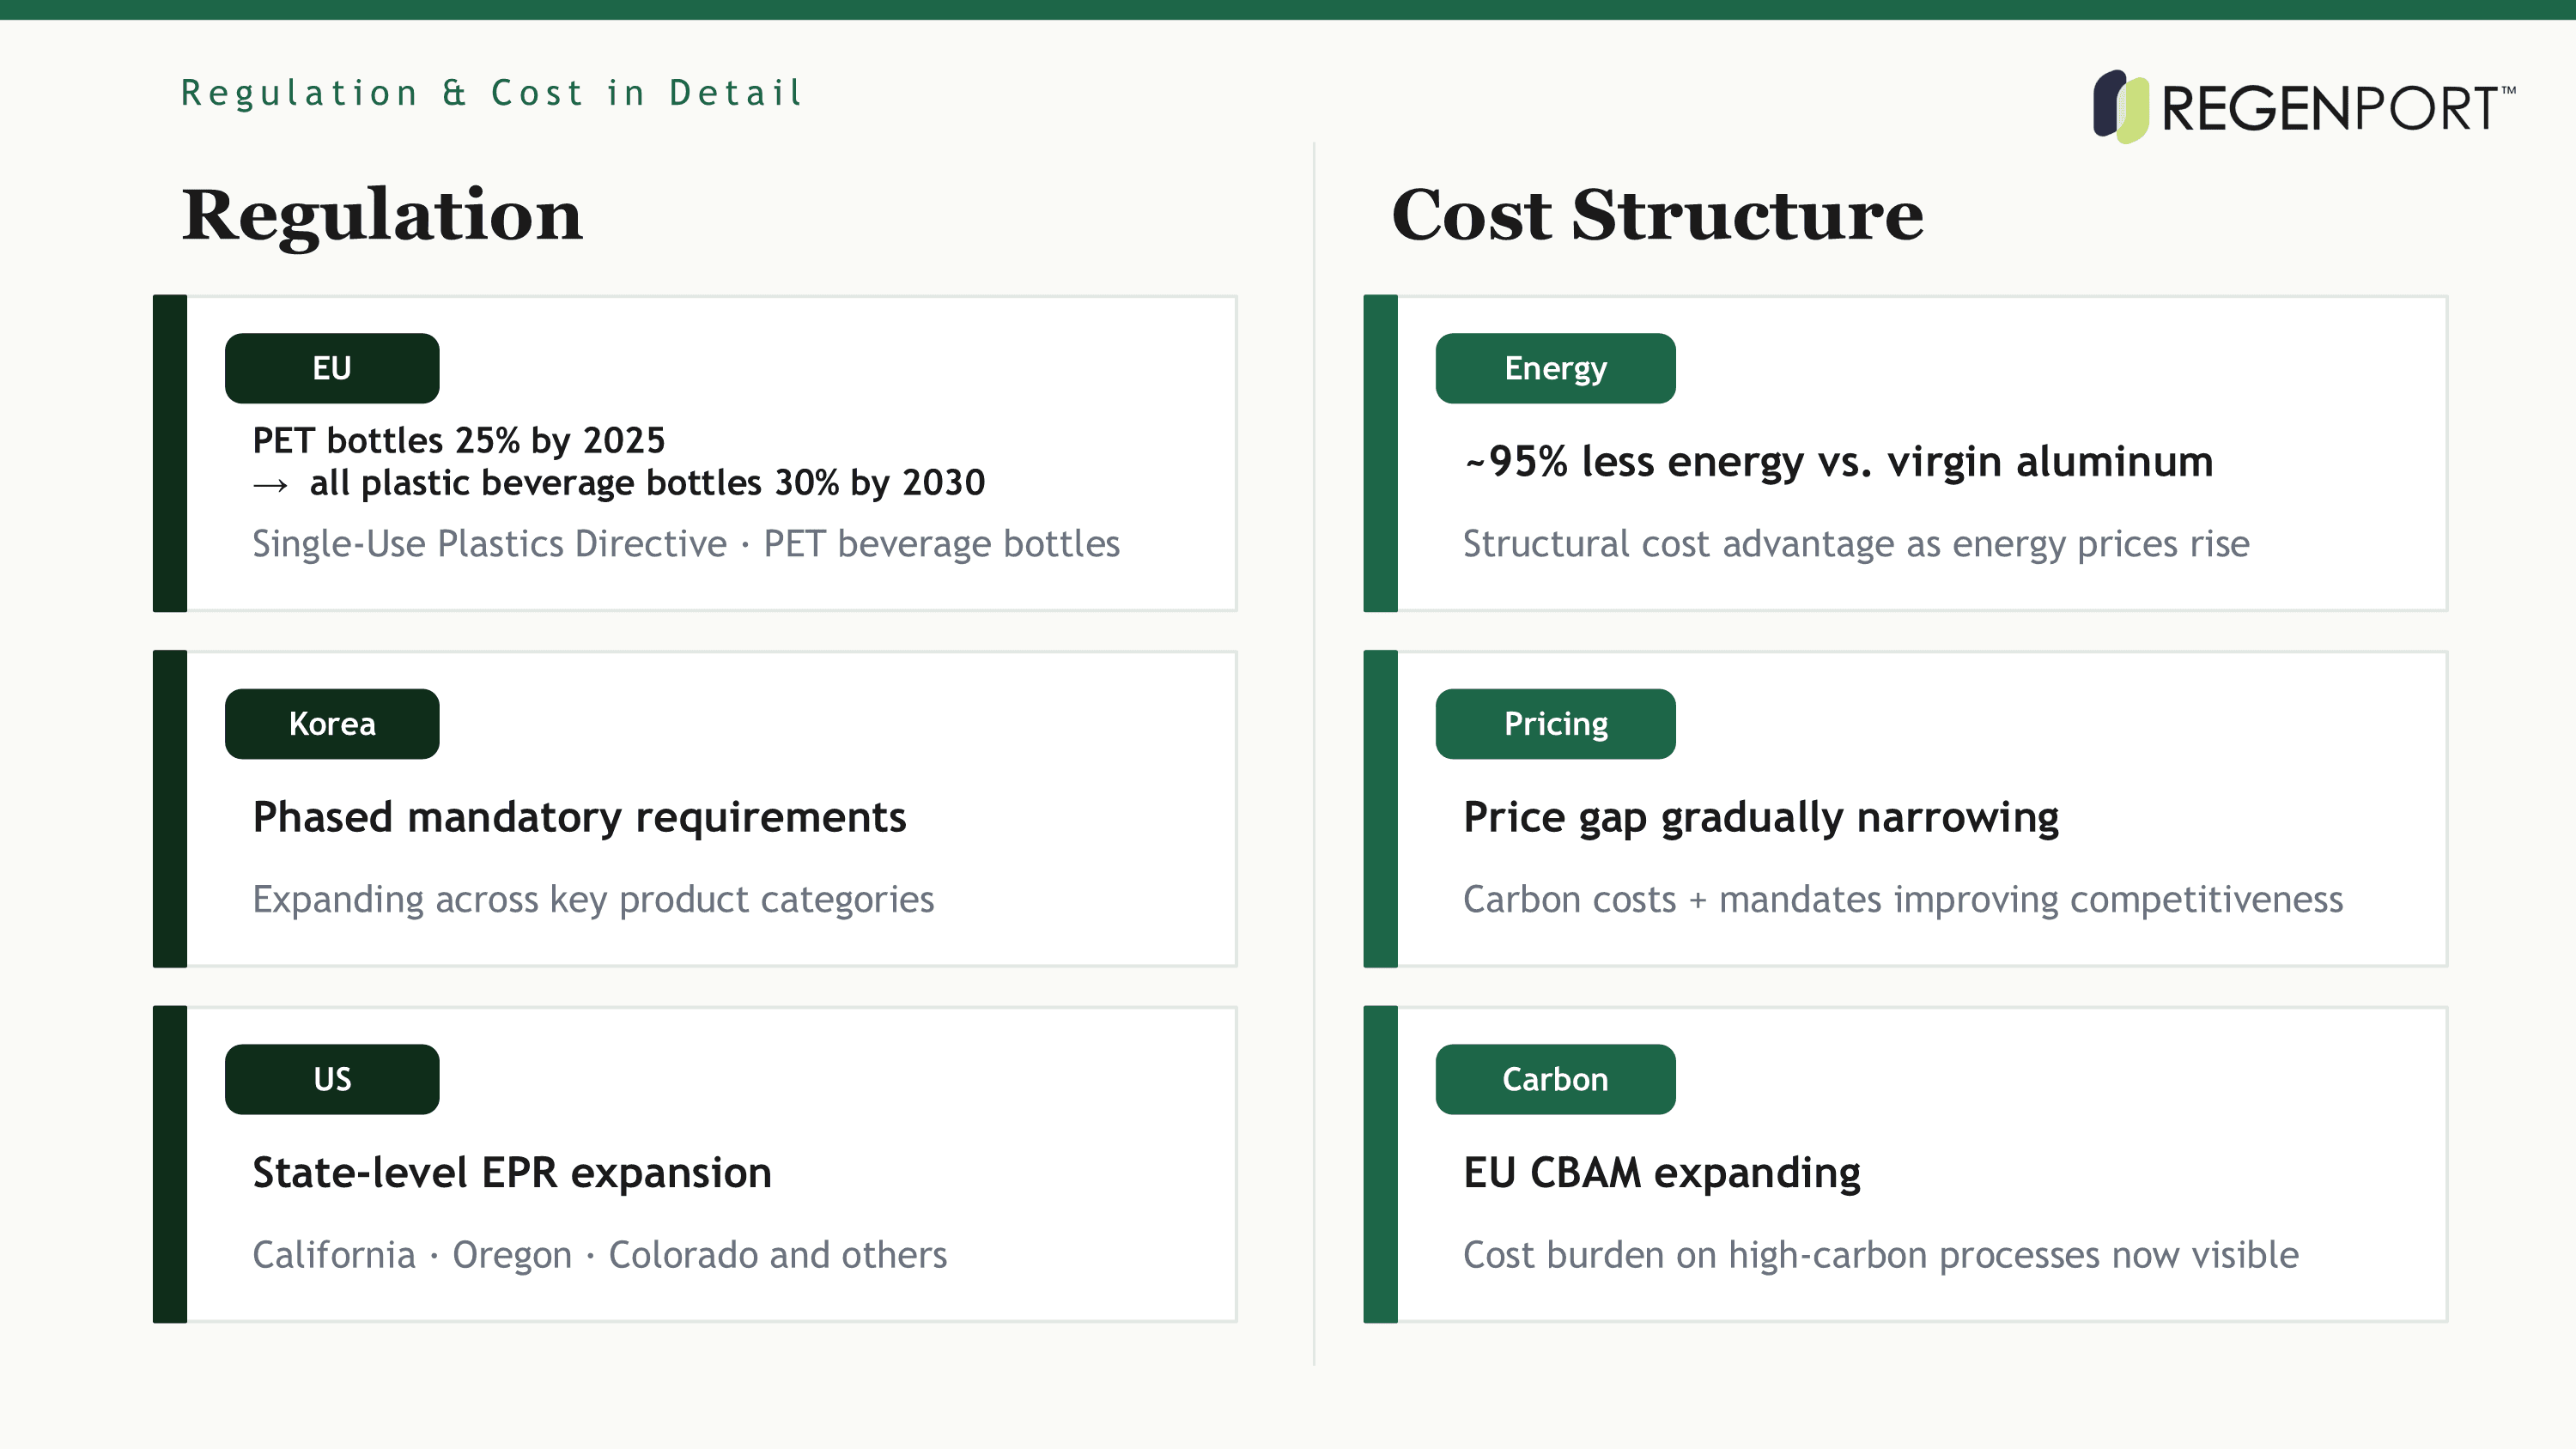
EU | PET beverage bottles must contain at least 25% recycled plastic by 2025, rising to 30% for all plastic beverage bottles by 2030 under the EU Single-Use Plastics Directive. |
|---|---|
KOREA | Phased mandatory recycled content requirements under active policy expansion, with obligations being introduced across key product categories. |
US | State-level recycled content and extended producer responsibility (EPR) regulations expanding across California, Oregon, Colorado, and others. |
Cost Structure in Detail
The economic case for recycled materials is strengthening independently of regulation. Three dynamics are at work:
ENERGY | Recycled aluminum requires approximately 95% less energy to produce than primary aluminum from bauxite ore — a structural cost advantage that grows as energy prices rise. |
|---|---|
PRICING | In some categories, recycled materials trade at a premium over virgin feedstock due to collection and processing costs. However, the price gap is gradually narrowing as carbon cost mechanisms, mandatory recycled content requirements, and supply chain pressure continue to increase. |
CARBON | As carbon regulations such as the EU Carbon Border Adjustment Mechanism (CBAM) expand, the cost burden on materials produced through high-carbon processes is becoming increasingly visible. |
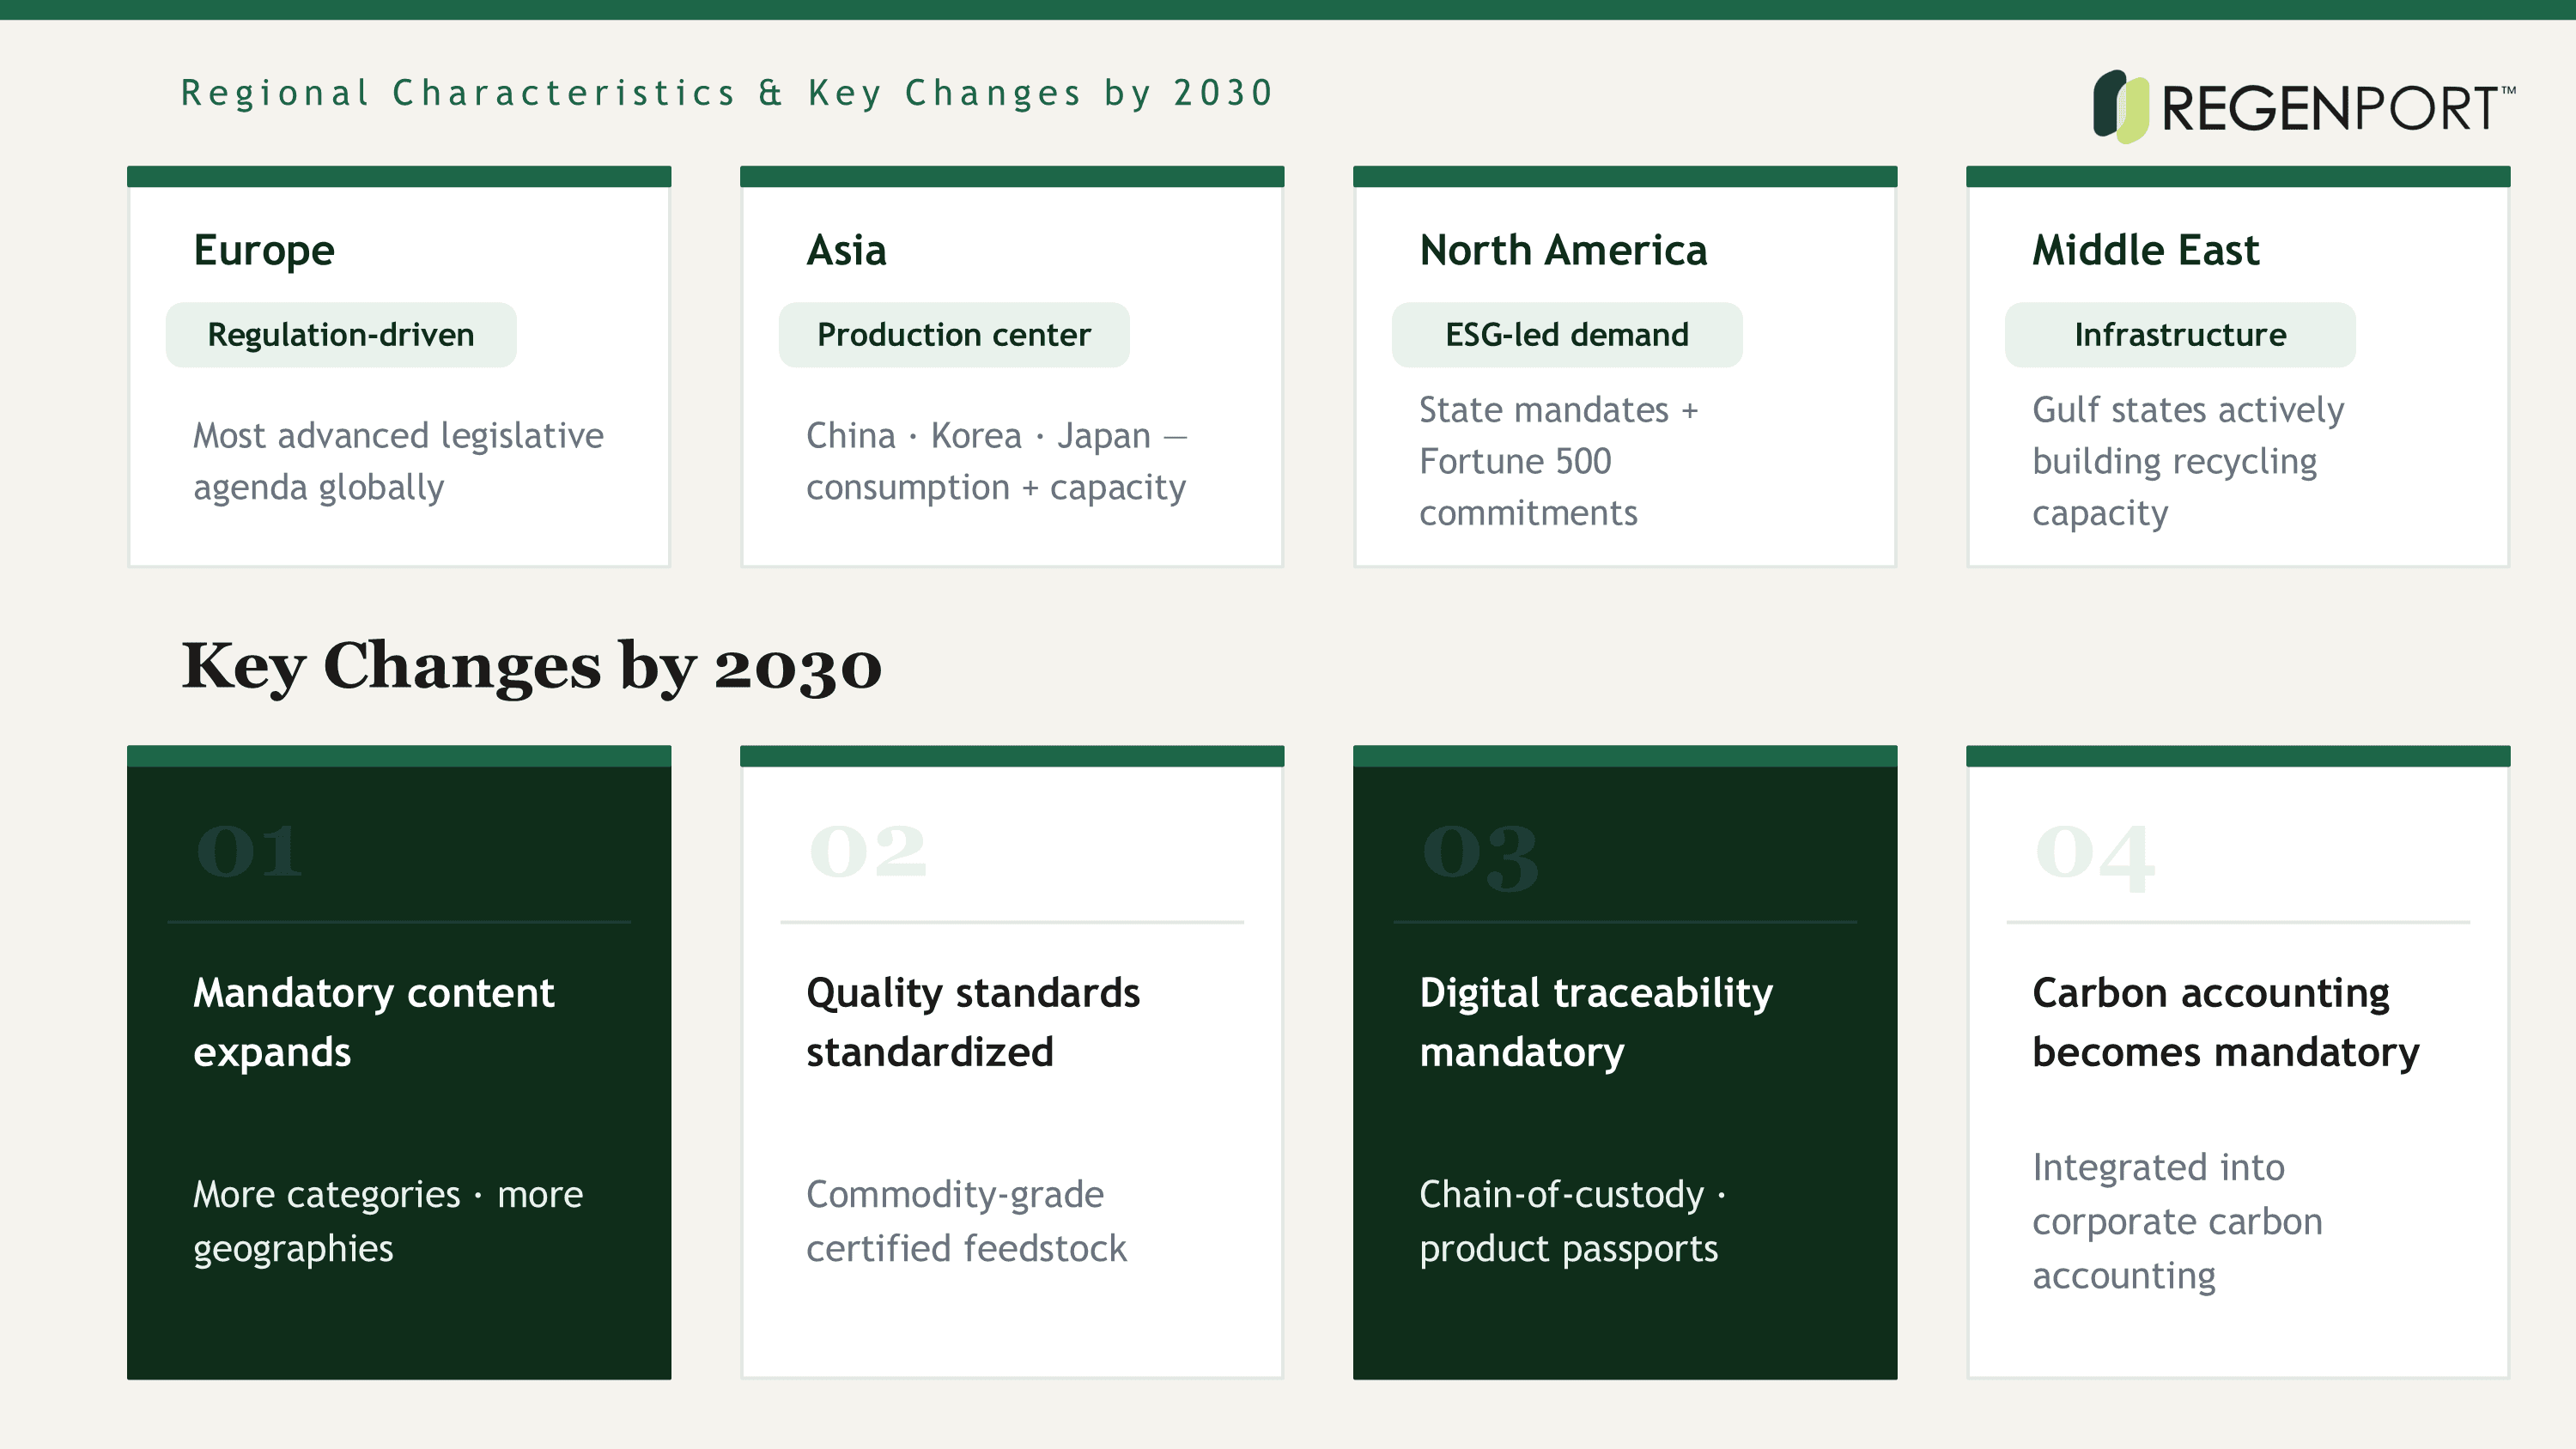
Regional Market Characteristics
Europe
Regulation-driven demand market. The EU's legislative agenda is the most advanced globally, creating the most predictable long-term demand signal for recycled feedstock producers.
Asia
Production and growth center. China, Korea, and Japan represent both major consumption markets and growing recycling processing capacity. Korea is expanding mandatory requirements.
North America
Policy and corporate ESG-led demand. State-level regulation combined with Fortune 500 sustainability commitments is driving demand ahead of federal mandates.
Middle East
Infrastructure investment phase. Gulf states are actively investing in recycling infrastructure as part of broader economic diversification strategies.
Key Market Changes by 2030
Mandatory content requirements expand in scope. More product categories and geographies will be subject to minimum recycled content obligations, creating a broader and deeper demand base.
Quality standards become standardized. Industry-wide certification frameworks will mature, reducing buyer uncertainty and enabling commodity-grade trading of certified recycled feedstock.
Digital traceability becomes mandatory. Chain-of-custody documentation and digital product passport requirements will make material provenance tracking a baseline requirement, not a premium feature.
Carbon market linkage deepens. Recycled material use will be increasingly integrated into corporate carbon accounting and offset frameworks, adding a financial incentive layer on top of regulatory requirements.
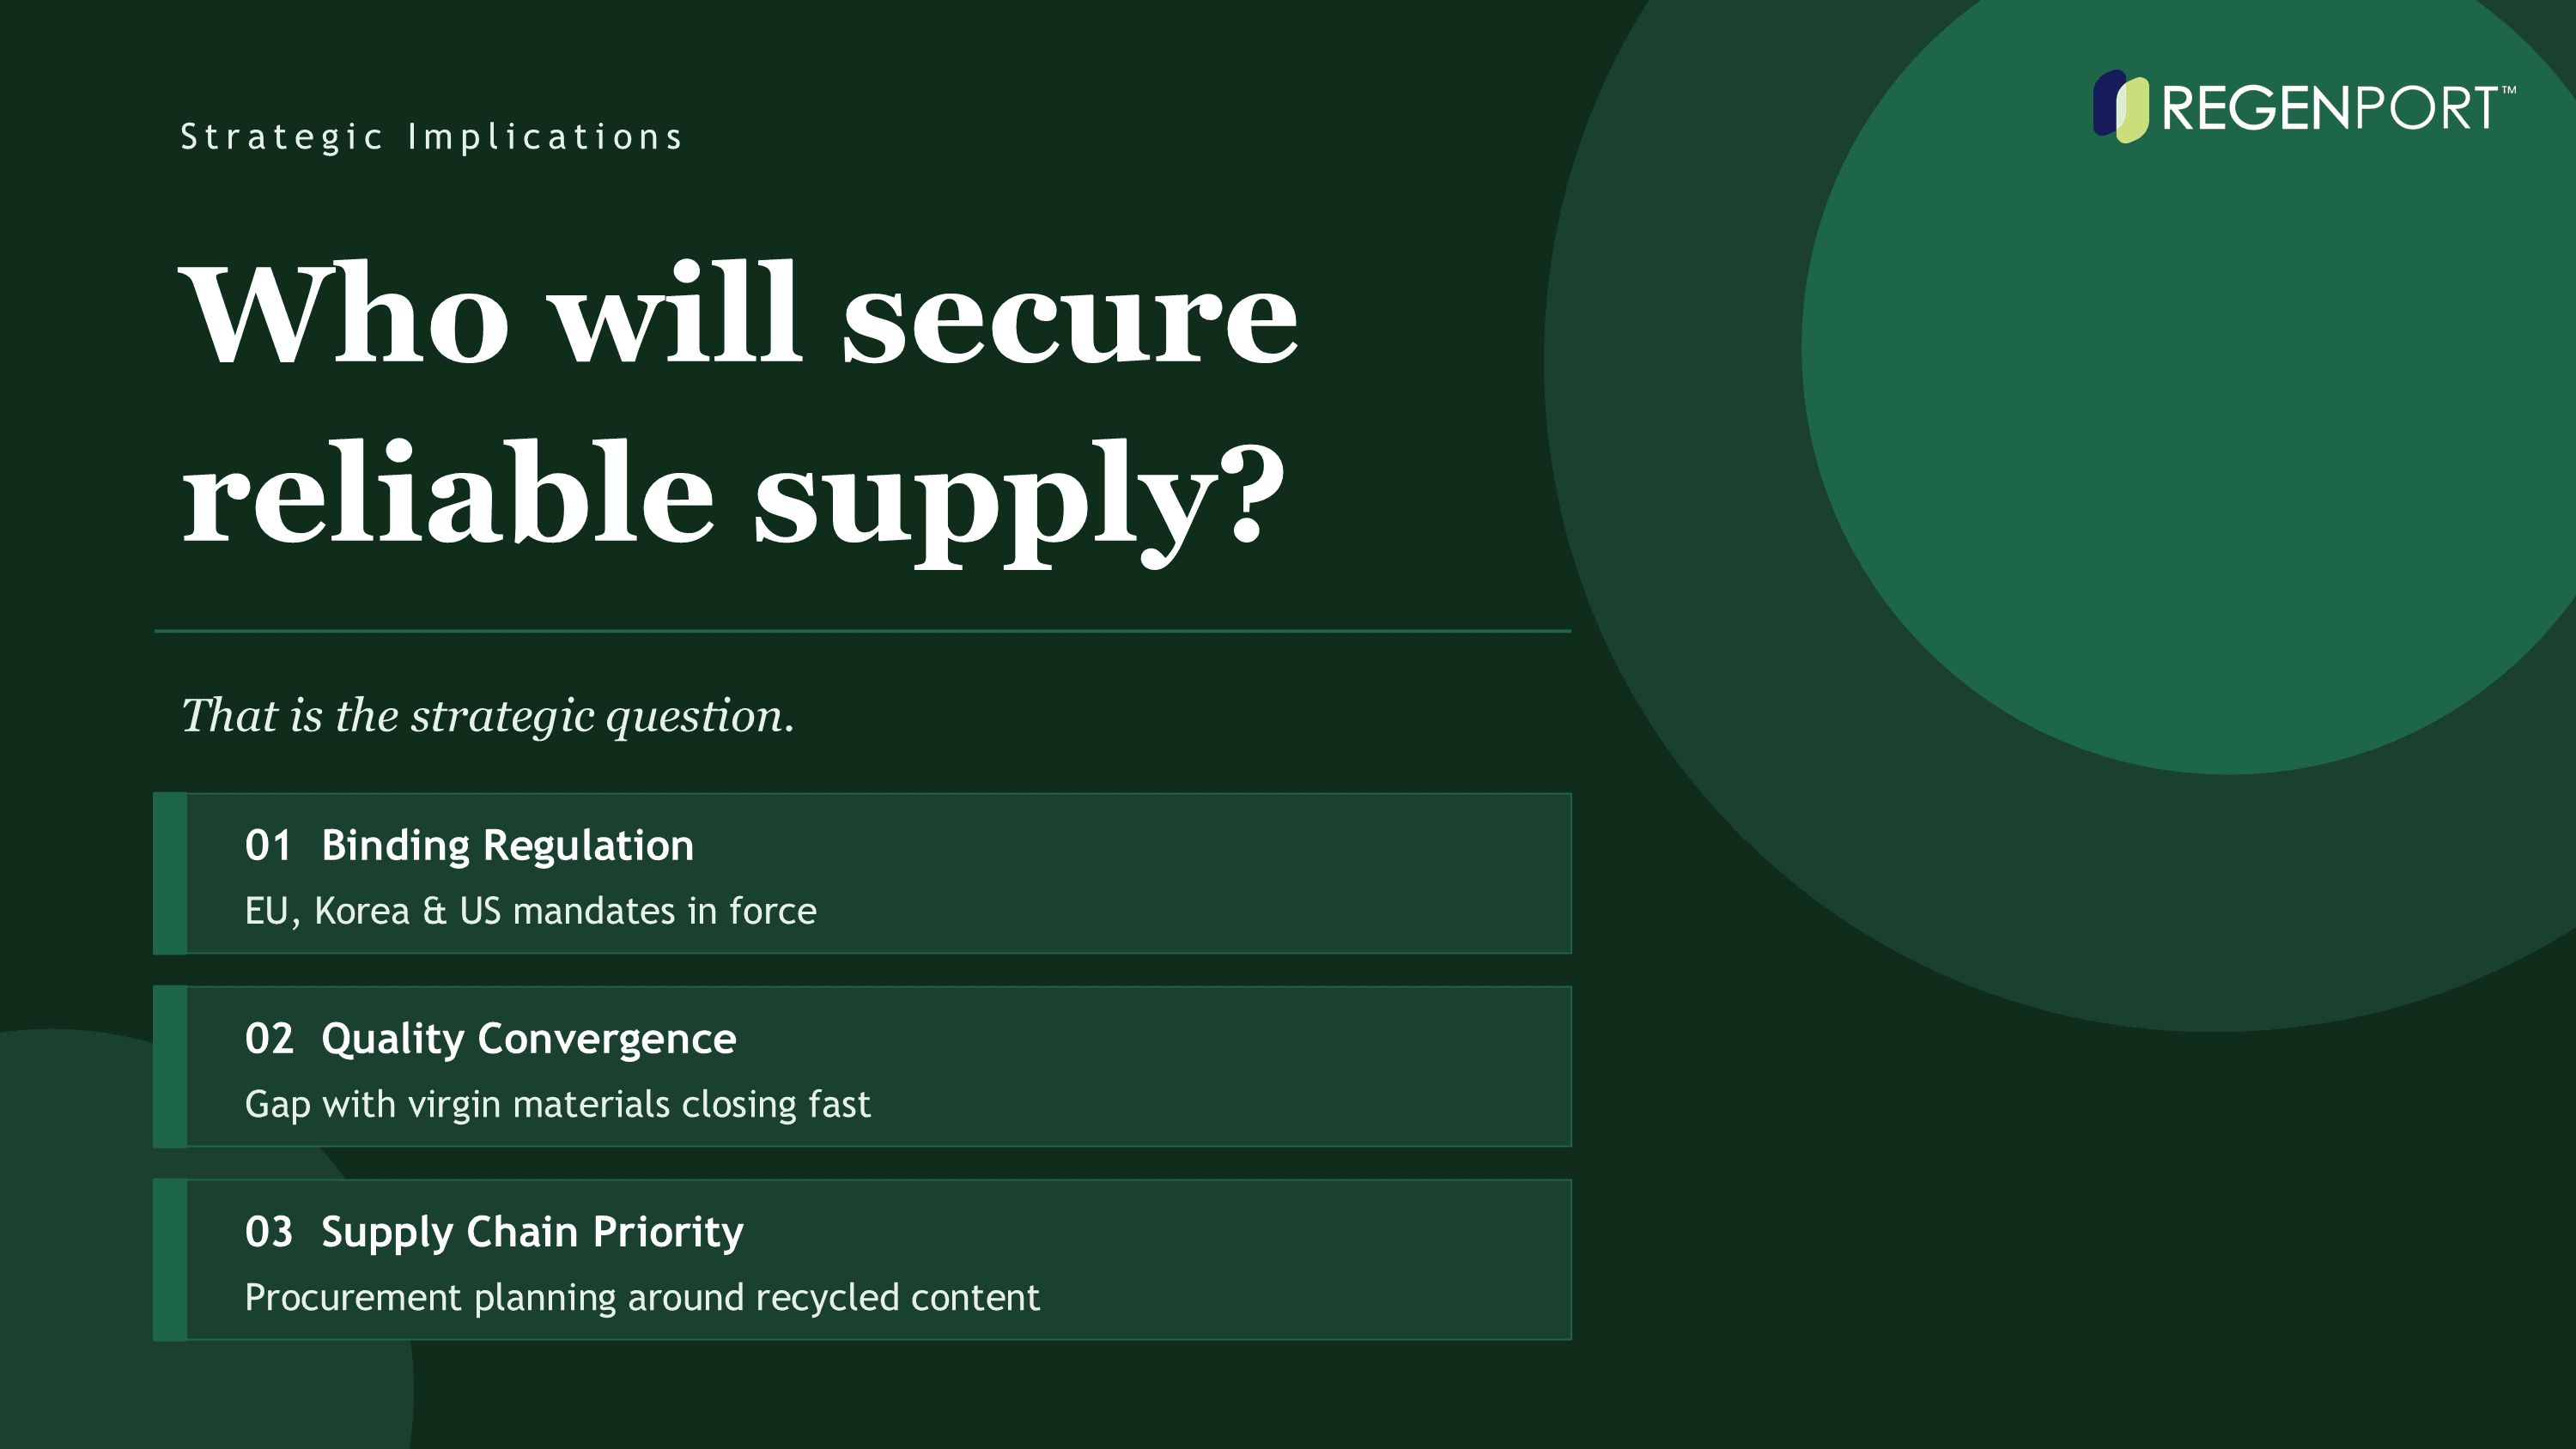
Strategic Implications
The recycled materials market has moved beyond environmental trend status. It is now a structural component of industrial supply chain strategy — shaped by binding regulation, shifting cost economics, and rapidly improving material quality.
Within this broader market, recycled plastics stand out as the segment with the most immediate regulatory pressure — mandatory content targets are already in force in the EU, with Korea and other markets following. Brand-owner commitments are creating additional pull-through demand that procurement teams must now plan around.
The central strategic question is no longer whether to incorporate recycled materials into the supply chain. It is who will secure reliable, quality-certified supply — and who will be left competing for what remains.
Image generated with ChatGPT and Claude
Grand View Research, Various Market Research Reports
Posted by Regenport
Regenport is a global platform connecting buyers and suppliers in the recycled materials and sustainable packaging industries.
Why the Recycled Materials Market Matters
The transition from a linear economy — extract, produce, discard — to a circular one is no longer a long-range ambition. It is being accelerated by two structural pressures: carbon neutrality mandates and raw material price volatility.
In response, recycled materials are gaining strategic importance across plastics, metals, and textile manufacturing. The question for procurement and supply chain teams is no longer whether to source recycled feedstock — it is how to secure reliable supply.
Global Market Outlook by Recycled Material
The global recycled materials market is best understood at the individual material level. Aggregated figures may not fully capture the different growth drivers, regulatory environments, and competitive structures across recycled plastics, recycled metals, and recycled textiles.
Material | 2023 Market Size | 2030 Projection | CAGR |
|---|---|---|---|
Recycled Plastics | $45 ~ 50 billion | $80 ~ 90 billion | 7 ~ 9% |
Recycled Metals | $120+ billion | Stable growth | 4 ~ 6% |
Recycled Textiles | Varies by source | Continued growth | Varies widely |
※ Market size and growth rate figures vary depending on the research provider and market definition. The data above is based on publicly available research and should be treated as reference estimates.
While growth rates differ across materials, the recycled materials market as a whole is projected to maintain stable, sustained growth through 2030.
What Is Driving Market Growth
Regulatory Expansion
Mandatory recycled content requirements are being enacted across the EU, Korea, and US states — creating structural, non-discretionary demand.
Cost Structure Shift
Rising virgin material prices and carbon cost mechanisms are improving the economic competitiveness of recycled feedstock.
Technology Maturation
AI-powered sorting, chemical recycling, and fiber-to-fiber textile processes are closing the quality gap with virgin materials.
ESG Demand Pull
Corporate sustainability commitments and investor ESG requirements are generating consistent pull-through demand across supply chains.
Regulation in Detail
EU | PET beverage bottles must contain at least 25% recycled plastic by 2025, rising to 30% for all plastic beverage bottles by 2030 under the EU Single-Use Plastics Directive. |
|---|---|
KOREA | Phased mandatory recycled content requirements under active policy expansion, with obligations being introduced across key product categories. |
US | State-level recycled content and extended producer responsibility (EPR) regulations expanding across California, Oregon, Colorado, and others. |
Cost Structure in Detail
The economic case for recycled materials is strengthening independently of regulation. Three dynamics are at work:
ENERGY | Recycled aluminum requires approximately 95% less energy to produce than primary aluminum from bauxite ore — a structural cost advantage that grows as energy prices rise. |
|---|---|
PRICING | In some categories, recycled materials trade at a premium over virgin feedstock due to collection and processing costs. However, the price gap is gradually narrowing as carbon cost mechanisms, mandatory recycled content requirements, and supply chain pressure continue to increase. |
CARBON | As carbon regulations such as the EU Carbon Border Adjustment Mechanism (CBAM) expand, the cost burden on materials produced through high-carbon processes is becoming increasingly visible. |
Regional Market Characteristics
Europe
Regulation-driven demand market. The EU's legislative agenda is the most advanced globally, creating the most predictable long-term demand signal for recycled feedstock producers.
Asia
Production and growth center. China, Korea, and Japan represent both major consumption markets and growing recycling processing capacity. Korea is expanding mandatory requirements.
North America
Policy and corporate ESG-led demand. State-level regulation combined with Fortune 500 sustainability commitments is driving demand ahead of federal mandates.
Middle East
Infrastructure investment phase. Gulf states are actively investing in recycling infrastructure as part of broader economic diversification strategies.
Key Market Changes by 2030
Mandatory content requirements expand in scope. More product categories and geographies will be subject to minimum recycled content obligations, creating a broader and deeper demand base.
Quality standards become standardized. Industry-wide certification frameworks will mature, reducing buyer uncertainty and enabling commodity-grade trading of certified recycled feedstock.
Digital traceability becomes mandatory. Chain-of-custody documentation and digital product passport requirements will make material provenance tracking a baseline requirement, not a premium feature.
Carbon market linkage deepens. Recycled material use will be increasingly integrated into corporate carbon accounting and offset frameworks, adding a financial incentive layer on top of regulatory requirements.
Strategic Implications
The recycled materials market has moved beyond environmental trend status. It is now a structural component of industrial supply chain strategy — shaped by binding regulation, shifting cost economics, and rapidly improving material quality.
Within this broader market, recycled plastics stand out as the segment with the most immediate regulatory pressure — mandatory content targets are already in force in the EU, with Korea and other markets following. Brand-owner commitments are creating additional pull-through demand that procurement teams must now plan around.
The central strategic question is no longer whether to incorporate recycled materials into the supply chain. It is who will secure reliable, quality-certified supply — and who will be left competing for what remains.
Image generated with ChatGPT and Claude
Grand View Research, Various Market Research Reports
Posted by Regenport
Regenport is a global platform connecting buyers and suppliers in the recycled materials and sustainable packaging industries.
More in this category
More in this category


Need a sample
Before Qualification?
Need a sample
Before Qualification?
Request a technical datasheet, sample,
or volume pricing information
Request a technical datasheet, sample,
or volume pricing information
Request a technical datasheet, sample,
or volume pricing information
CONTACT OUR TEAM
CONTACT OUR TEAM
CONTACT OUR TEAM
sales@e-connect.kr ↗
sales@e-connect.kr ↗
sales@e-connect.kr ↗
We typically respond within 24 hours.
We typically respond within 24 hours.
We typically respond within 24 hours.

Technical
Datasheet
Technical
Datasheet

Sample
Request
Sample
Request

Volume
Pricing
Volume
Pricing

Supply
Availability
Supply
Availability
All
All
All
Post
Post
Post
GRS & GR Certified PCR rPP Pellets: Traceable Recycled PP for Reliable Sourcing
GRS & GR Certified PCR rPP Pellets: Traceable Recycled PP for Reliable Sourcing
EU Tightens Plastic Waste Export Rules: What Will Happen to Europe's PCR Supply Chain?
EU Tightens Plastic Waste Export Rules: What Will Happen to Europe's PCR Supply Chain?
Food-Contact Recycled Plastics: What "Recycled" Doesn't Automatically Mean
Food-Contact Recycled Plastics: What "Recycled" Doesn't Automatically Mean
Recycled Polymer Market Faces Continued Pressure as Virgin Prices Weaken and Freight Costs Rise – Week 4, June 2026
Recycled Polymer Market Faces Continued Pressure as Virgin Prices Weaken and Freight Costs Rise – Week 4, June 2026
rLDPE PIR Pellet: Not All Recycled LDPE Materials Are the Same
rLDPE PIR Pellet: Not All Recycled LDPE Materials Are the Same
CONTACT US
+82 70-7594-2321
450, Gangnam-daero,
Gangnam-gu, Seoul 06123,
Republic of Korea
Privacy Policy
Terms of Service
© 2026 RegenPort Inc. All rights reserved.
CONTACT US
+82 70-7594-2321
450, Gangnam-daero,
Gangnam-gu, Seoul 06123,
Republic of Korea
Privacy Policy
Terms of Service
© 2026 RegenPort Inc. All rights reserved.
CONTACT US
+82 70-7594-2321
450, Gangnam-daero,
Gangnam-gu, Seoul 06123,
Republic of Korea
Privacy Policy
Terms of Service
© 2026 RegenPort Inc. All rights reserved.
